
Earlier this week I was having a conversation about data centres, AI, and the fairly febrile state of mind surrounding both of them at the moment.
There are sensible arguments to have about where data centres go, what they require and who benefits from them. There are even bigger arguments about what AI might do to work, to public services and to the institutions we rely on. But both also seem to have become lightning rods for a wider uncertainty about where all this is heading, who is in control of it, and whether the people making the decisions can be trusted to make them well.
And in the course of the conversation, my colleague Barbara asked whether I’d had a look at the most recent OECD work on public trust.
I hadn’t. Which was a surprise given that public trust is something I come back to quite often.
It’s central to the thinking I’ve done about data in government and whether people feel they have any meaningful say in policymaking. It turns up in apparently narrower questions, like rolling out CivWifi for all, and in much bigger ones about what sort of institutions are trusted enough to carry us through whatever AI does to the world of work.
And yet, despite that, I’d completely missed the fact that the OECD’s latest edition had come out. I hadn’t seen anyone give it much coverage either. Maybe it simply passed me by over the summer.
But I think back to the 2024 edition, which also seemed to pass without much comment, and I think public trust is hugely underweighted in the way we talk and think about the challenges facing the UK and elsewhere. If I’d been in any of the conversations about the missions (RIP?), I would have called rebuilding public trust one of them. Not because trust is an end in itself, or because everybody ought to agree with government, but because as we’ve seen, it’s hard to do very much that is difficult, disruptive or long term if large numbers of people start from the assumption that government is incompetent, dishonest, unfair, uninterested in them, or some combination of the four.
AI is already a trust question
Anyway, back to the trust survey. For the first time, the OECD asked people what they expect if government agencies use AI. The British results do not say that people are simply against it.
They are more uncertain than that. 39% are confident AI would produce more tailored services and 36% that it would reduce government costs. When the questions turn to protecting personal information, keeping humans in control of important decisions, transparency and fair treatment, confidence sits between 31% and 35%.
But on all six measures Britain is less positive than the OECD average.1
Across the OECD there are also a lot of people in the middle, unsure what to expect. The OECD’s own analysis describes plenty of scepticism, but also high levels of neutral and don’t know responses.
That feels important. AI may be a litmus test here as much as a subject in its own right. We are contemplating technologies that might change jobs, reshape public services, require real physical infrastructure, power and water, and give governments capabilities they didn’t previously have. We’re also finding those topics subject to some fairly breathless reporting, which doesn’t exactly help anyone keep these sorts of questions in perspective.
Nevertheless, it is perfectly legitimate for people to be unsure about where all this takes us. And there is a natural flow from uncertainty about technology into a question about public trust and particularly what we think about the institutions responsible for navigating what comes next.
Britain is no longer quite the outlier
So when Barbara mentioned the survey I realised I needed to revisit my priors and find out what the newer data said about the UK because when I wrote about it in 2024, Britain’s results were abject.
Then only 27% of people reported high or moderately high trust in national government.2 The UK was 29th of the 30 countries surveyed. Trust in political parties was 12%, in the news media 19%, in Parliament 24%. On every one of the OECD measures about how government handled difficult, long-term decisions, Britain was below the OECD average.
It was pretty compelling as the basis for arguing that Britain had a trust problem.
It was also a useful contrast with the mundane bits of government that people felt worked better than the politics around them. 74% of recent users were satisfied with administrative services and 79% thought information about administrative procedures was easy to find. But only 20% thought the political system allowed people like them to have a say.
The new data has made that tidy contrast considerably harder to sustain. For a start, there’s some good news.
Trust in national government is back up to 33%. That’s not spectacular, not by a long way when the OECD average is now 40%. But Britain is no longer sitting forlornly one place off the bottom of the table. We’re now 24th out of 33 OECD countries.3 It’s hardly amazing but no longer relegation fodder.
And that improvement is not confined to the headline number.
Trust in Parliament has gone from 24% to 30%. Political parties have somehow managed to double their score, from an extremely low 12% to a merely low 24%. Trust in the news media has gone from 19% to 37%.
Meanwhile, trust in the civil service has fallen from 45% to 39%, the police from 56% to 52%, and the courts from 62% to 55%.
There is no single national trust-o-meter
These are conflicting stories. This is not behaving like one national trust-o-meter.
And Britain isn’t especially unusual in that respect.
Across the OECD, trust in national government has broadly stabilised rather than recovered to some new high. Only eight of the 33 OECD countries surveyed now have a majority saying they have high or moderately high trust in their national government. And underneath that average are countries moving in quite different directions.
Britain is one of a group, alongside Iceland, Norway, Korea and Portugal, where a substantial fall in trust has been followed by a substantial recovery. France has gone the other way. Australia has managed increases across successive waves; the Netherlands successive declines.
The institutional differences within countries are at least as interesting.
Share of population with high or moderately high trust, OECD 2025
The unweighted OECD average of responses to the question “On a scale of 0 to 10, where 0 is not at all and 10 is completely, how much do you trust [insert name of institution]?” Shown here is the share with high or moderately high trust corresponding to those who select an answer from 6 to 10 on the 0-10 response scale.
Source: OECD Survey on Drivers of Trust in Public Institutions 2026 Results, Table 1.3. OECD accession candidates are excluded; the OECD average is the unweighted average of weighted country averages. Table 1.3 reports 46% for the 2025 OECD civil-service average; the UK country-note prose reports 45%.
France is perhaps the most dramatic example of why one column cannot stand in for the whole state. Only 22% of French respondents report high or moderately high trust in national government, the lowest figure of the 33 OECD countries surveyed. But 52% trust local government, 51% the civil service and 65% the police. You can apparently have a profound crisis of confidence in national politics without concluding that every institution of government is failing you.
Switzerland has plenty of trust. It tops the table for national-government trust at 62%, with that confidence sitting alongside 68% for local government, 62% for the civil service, 72% for the courts and 77% for the police. Even political parties, pretty unloved almost everywhere, manage 49%. Hard not to wonder how much the nature and design of Swiss democracy has to do with that.
As with other countries, Britain’s movement is uneven. Confidence in national government, Parliament, political parties and the media has risen while trust in the civil service, police and courts has fallen.
So the move from 27% to 33% is a good sign. But it is one measure of one institution. It does not tell us whether Parliament, the civil service, public services or people’s sense of political voice are moving with it. In Britain, they plainly aren’t. Which makes the interesting question less “has trust gone up?” and more “what exactly has moved, and for whom?”
What changed underneath the headline?
The shift gets more interesting when I go back to the part of the survey I leaned on most heavily in 2024. Back then the OECD’s verdict was unusually stark: Britain was below the OECD average on every single measure of decision-making on complex policy issues.
But now, the UK is above the OECD average on seven of the fifteen measures.
That is quite a change.
The individual movements are interesting too. The proportion believing government uses the best available evidence has risen from 37% to 44%. Belief that government can balance the interests of today’s population with future generations has gone from 25% to 33%. And the proportion who think the political system allows people like them to have a say has jumped from 20% to 34%.4 I mean, none of those numbers are exactly a triumph, but the direction is welcome.
The OECD’s wider analysis says these kinds of judgements, about how government handles difficult choices, uses evidence and listens, are more strongly associated with trust in national government than many of our everyday encounters with administration. The OECD’s decomposition goes a step further: in the UK, the measured improvements in those perceptions would have predicted a larger rise in trust than the one that was actually observed.
And this is where the old story really starts to come apart.
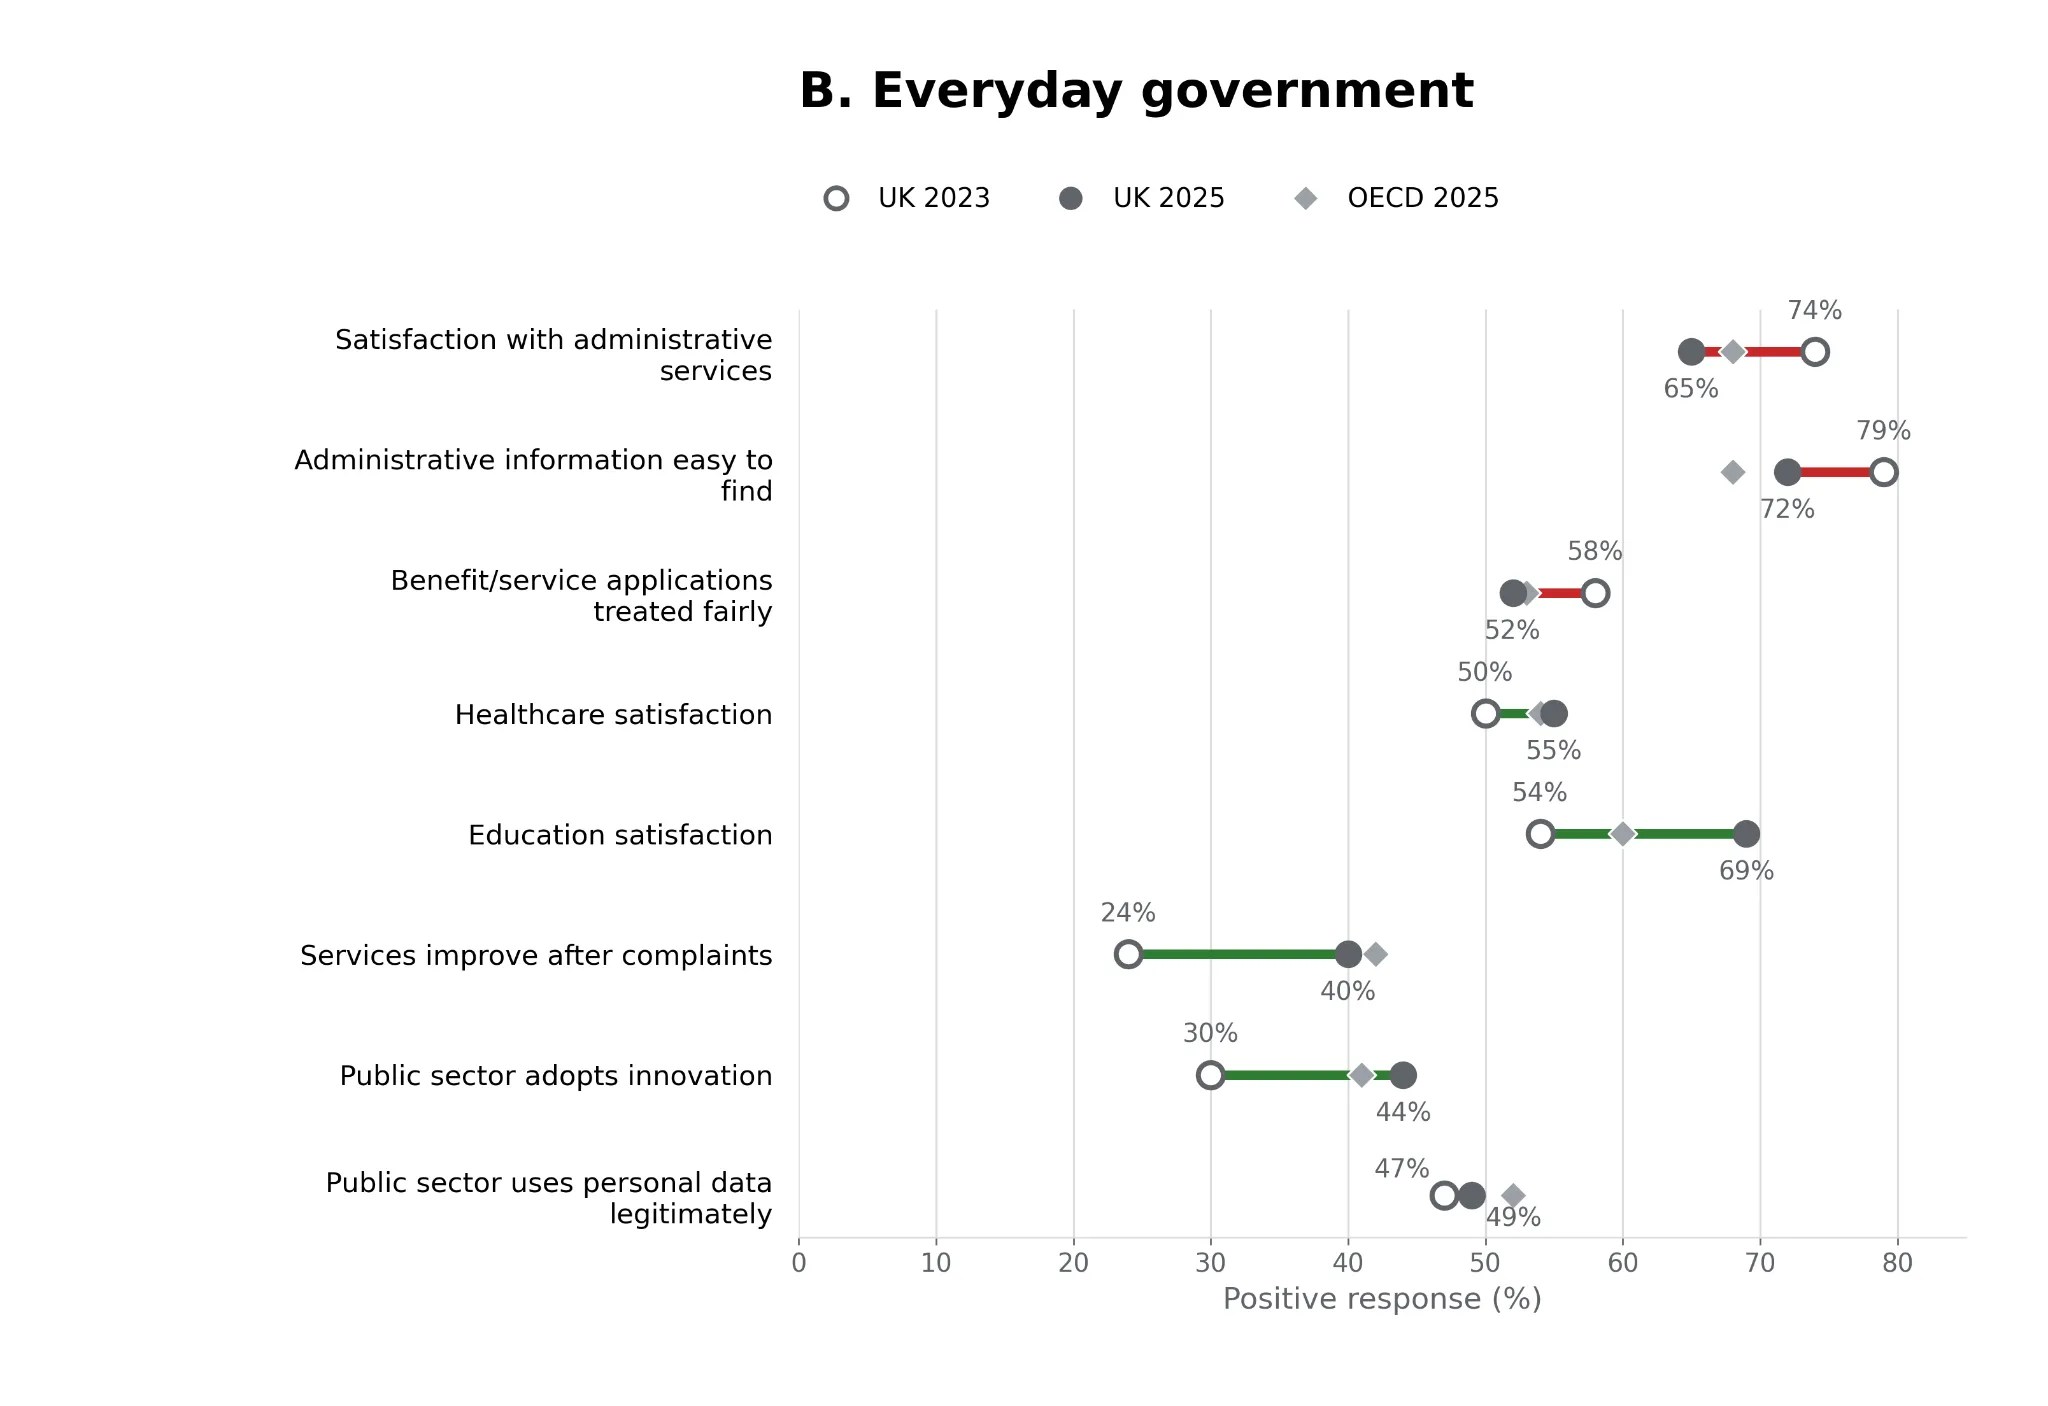
There is something here that should worry those of us who spend our time thinking about the quality of digital transformation and asking questions about the state of those efforts. GOV.UK turns 14 next month, and Britain is justifiably proud of the influence its approach to digital government has had. And yet, some of the things I was praising last time have gone backwards. Among recent users, satisfaction with administrative services has fallen from 74% to 65%. Perceived fairness when applying for benefits or services from 58% to 52%; ease of finding administrative information from 79% to 72%.5
But even here it refuses to become a convenient story about services deteriorating while politics improves. Among recent users, satisfaction with healthcare and education is up (and since we’re talking about education, it is worth pausing to note just how impressive England’s latest PISA results are6). So is the proportion who think services improve after complaints and that the public sector adopts useful innovation.
Overall the OECD says Britain is now above its average on six of thirteen day-to-day measures.

Competent administration still matters enormously. My professional life is spent thinking about the plumbing underneath government precisely because people experience the state through forms and services and systems that either help or make their lives harder.
But this data makes it harder to treat good administration as a proxy for public trust. People are also making judgements about whether government can make difficult choices competently, explain itself, resist improper influence, take account of different interests and leave people feeling that they count.
And there has been some movement on that. The share saying that people like them have a say has risen from 20% to 34%. That’s encouraging and it’s also not remotely job done. The gap in national-government trust between people who feel they have political voice and those who do not is now 55 percentage points, larger than the already enormous 47-point gap across the OECD.7
Who trusts government now?
Then there are two findings I’m not quite sure what to do with.
Half those with a post-secondary degree report trusting national government, compared with 19% of those without upper-secondary education (to translate from OECD-speak: roughly, people with a degree versus people without A-levels or equivalent). Among 18–29-year-olds the figure is 46%; among people over 50 it is 24%.
Both relationships were the other way round in 2023.8
It’s tempting to look at that and point to the change of government between the surveys, and conclude that trust has simply moved from one political coalition to another.
And there is probably something in that. Party alignment is clearly part of the picture. But there is also an important wrinkle in comparing the two waves. The OECD says the core survey methodology is designed to be comparable over time, but the UK changed how its fieldwork was done: ONS collected the 2023 responses online and by telephone; in 2025 the UK moved to an Ipsos online panel.9 That does not tell me that methodology caused any of these reversals. But it is enough to stop me treating something this dramatic as a clean measure of social change.
And a purely partisan explanation does not quite clear everything up anyway. During the OECD fieldwork in September 2025, Ipsos had Reform on 34% and Labour on 22%. Only 13% were satisfied with Keir Starmer as Prime Minister and 12% were satisfied with the government.10 At roughly the same time, the OECD was finding 33% with high or moderately high trust in national government and notably better perceptions of several aspects of governing.
Those surveys are not asking the same question. That is precisely the point.
I can think the Prime Minister is doing a bad job. I can intend to vote the governing party out. Neither answer is the same as the OECD asking, on a 0–10 scale, how much I trust “the national government”. And that trust question is different again from whether I think the political system gives people like me a say, or whether government uses evidence well. They are related but they are not interchangeable.
The same caution applies to political voice. Immigration was one of the biggest public concerns as the OECD survey began, so it would be easy to wonder whether the extraordinary political attention around it was making some previously ignored voters feel heard. Except research published by Ipsos, King’s College London and LSE just as the OECD fieldwork began, albeit based on a survey from April, found 72% of Reform supporters saying people like them were powerless to change things in Britain.
So even having your issue dominate the political conversation does not necessarily mean you feel that you have much power over what happens next.
So I don’t think these findings collapse into a simple change-of-government story. But they do make the demographic shape of trust look much less fixed than I had assumed. Even the groups doing the trusting and distrusting can look dramatically different from one wave to the next.
So what does rebuilding trust actually mean?
Britain still has a trust problem. A third of the country reporting high or moderately high trust in national government is bad. Maybe no longer awful, but still pretty dreadful.
So we are no longer the extraordinary outlier of two years ago. Some of the very things that looked particularly broken in 2023 have improved, in some cases enough to put Britain around or above the OECD average. At the same time some of the administrative strengths I contrasted them with have weakened, and different institutions and groups are moving in quite different directions.
If somebody does not trust government, what exactly do they not trust? Its competence? The fairness of the outcome? The honesty of the people involved? Whether their voice counts? The service in front of them? Or simply the particular occupant of Downing Street?
Those distinctions matter because the answers imply different work. Better services will not by themselves make people feel politically powerful. A consultation will not compensate for a benefit decision that feels arbitrary. And a change of government may alter who feels represented without doing much about the institutions and processes through which we choose to represent ourselves.
They also matter when we come back to AI.
The interesting thing about those uncertain answers on government use of AI is not that they reveal some great national hostility to the technology. They don’t. It is that government is being asked to manage a change about which people are already uncertain without starting from a position of abundant trust in its competence, fairness, transparency or judgement.
Data centres and AI become lightning rods partly because the technology is unfamiliar and its consequences are uncertain. But they aren’t creating these trust problems. They’re stress tests for whichever versions of them are already there: whether government can make difficult decisions well, explain what it is doing, balance different interests and give people reason to believe that they have some place in the choices being made.
If rebuilding trust were to be a mission, it can’t mean treating trust as another KPI to push upwards. It starts with being clear about which relationship is failing, between whom, and what government can plausibly do about it.
Perhaps that means the mission is not really to make people trust government more. It is to make government more worthy of trust: in its decisions, its institutions and the everyday ways people encounter it.
We still have a trust problem and actually, the data suggests we’ve got more than one.
- For comparison, the OECD averages are 43% for more tailored services and 42% for lower costs, then between 32% and 37% across the four questions about protecting personal information, human oversight, transparency and fair treatment. Here “confident” means answering 6–10 on a 0–10 scale. These are questions about what people expect government use of AI to achieve, not whether they support or oppose it. Source: OECD (2026), Chapter 5, Figure 5.2 and the UK country note. ↩︎
- An OECD consistency wrinkle worth flagging: the UK country-note series reports 27% for national-government trust in 2023, which is also the figure published when I wrote about this in 2024. Table 1.3 in the full 2026 report gives 29% for the same measure, without explaining the difference. I use the originally published UK figure of 27%. Source: OECD (2024), UK country note, Figure 1; OECD (2026), UK country note; OECD (2026), Table 1.3. ↩︎
- For a sense of where that leaves us: the UK is at 33% against an OECD average of 40%. Switzerland is highest at 62% and France lowest at 22%. Twenty-three of the 33 OECD countries surveyed are above the UK, which is how we get to 24th place. Source: OECD (2026), Table 1.3. ↩︎
- The OECD averages for the three measures quoted here are 42% for using the best available evidence, 34% for balancing the interests of current and future generations and 31% for political voice. That last measure ranges from 14% in Latvia to 65% in Switzerland; the UK is at 34%. Source: OECD (2026), Chapters 4 and 6 and the Latvia, Switzerland and UK country notes. ↩︎
- For some international perspective: 65% of recent UK users are satisfied with administrative services against an OECD average of 68%; Luxembourg is at 86% and Chile at 48%. On fair handling of benefit or service applications, the UK is at 52% against 53% across the OECD, with Finland at 75% and Colombia at 26%. And 72% in the UK say administrative information is easy to find, above the 68% OECD average; Ireland is highest at 84%. Source: OECD (2026), Chapter 3 and the Luxembourg country note, Chile country note, Finland country note, Colombia country note and Ireland country note.. ↩︎
- And since I have allowed myself the PISA cheerleading: UK 15-year-olds scored above the OECD average in mathematics, reading and science in PISA 2025, with the UK among the top ten education systems overall. PISA obviously isn’t a measure of satisfaction with education services; I mention it as a separate reminder that there are outcomes worth celebrating as well as perceptions. Source: OECD (2026), PISA 2025 Results, UK country note; Department for Education (2026), PISA 2025: national report for England. ↩︎
- This is a big gap everywhere. Across the OECD, 69% of people who feel they have political voice trust national government, compared with 22% of those who do not: a 47-point difference. In the UK the gap is 55 points. Australia has the largest gap at 60 points and Chile the smallest at 36. Source: OECD (2026), Chapter 2 and the UK country note. ↩︎
- The UK differences are unusually large. Its 31-point education trust gap compares with 14 points across the OECD. And while 18–29-year-olds are five points less trusting of national government than people aged 50+ on average across OECD countries, in Britain they are 22 points more trusting. Those are striking reversals, which is why the fieldwork difference between the two UK waves matters. Source: OECD (2026), Chapter 2 and the UK country note. ↩︎
- The UK is slightly unusual here. In 2023 ONS collected the UK survey online and by telephone; in 2025 it was collected online by Ipsos. This was not a wholesale redesign of the OECD survey: the OECD says the core methodology and questionnaire were maintained, and most countries used Ipsos online in both waves. Of the six countries that ran their own collection in 2023, five did so again in 2025; the UK was the one that moved into the centralised collection. So this could be a reason for caution, not an explanation of the reversal. Source: OECD (2024), Annex B, Table B.2; OECD (2026), Annex A, Table A.3. ↩︎
- These really were overlapping snapshots. OECD fieldwork in the UK ran from 10 September to 21 October 2025; the Ipsos Political Monitor was in the field from 11 to 17 September. Ipsos had Reform UK on 34% and Labour on 22%, while just 13% were satisfied with Keir Starmer as Prime Minister and 12% with the government. Source: OECD (2026), UK country note; Ipsos Political Monitor, 27 September 2025. ↩︎